BUSINESS CHALLENGE:
Data Analytics is applied in Factory Optimization at various stages. ‘Finished Goods Optimization’ is performed by controlling the characteristics of the finished goods. This case study involves a manufacturer of premium instant coffee where an optimized solution was provided. One of the key characteristics that define the quality is moisture content in the coffee. As per international standards, the maximum allowable limit is 5% of moisture. But customer requirements vary from 2 – 4%. The manufacturing process is very complicated and operated in a highly controlled environment. Multiple instruments are used to maintain 32 process parameters at desirable levels. Low Pressure (Vacuum) and Temperature are key control parameters in this. There are 10 temperatures and usually, these values are adjusted to attain desired Moisture level.
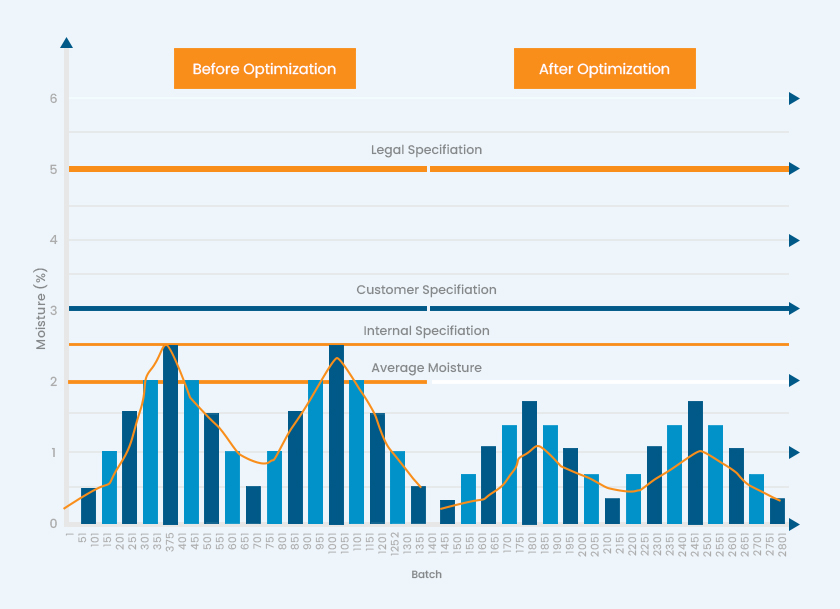
Currently, the temperature settings which play a key role in moisture control are adjusted based on operators’ knowledge. These settings significantly differ by operators. Also, the requirements from client to the factory operators get shrunk to make sure coffee passes the quality check. This “Bull-Whip Effect” leads to substantial overdrying of the product which reduces the yield.
APPROACH:
 Our Analytics team studied the current process and associated data collected through IIOT Sensors. Currently, operators set the target moisture significantly lower than the target, for eg: 2.5% for customer requirement of 3% and 1.8% for customer requirement of 2.0%. It is also observed that for target moisture of 2.5%, the mean moisture for a year was 2.0% with a standard deviation of 0.27.
Our analytics team formed the following steps in solving this challenge.
- Data Collection: Collected all 32 data points such as Ten temperatures, vacuum pressure, and other sub- process data from the SCADA system every second.
- Data Preparation: We wrote a special program that maps data at different stages for a batch from start to end.
- EDA: Once the data is transformed as above, Exploratory Data Analysis (EDA) was performed. While there are various values, the team performed “Pattern Analysis” and identified critical variables that have huge impact on moisture and can be controlled effectively.
- Model Building: DA team built various algorithms such as “Decision Tree Algorithm” followed by “Multivariate Polynomial Regression”. The first equation came out with 17 variables and then was reduced to 3 variables.
- Recommendations: The final recommendation given to the factory management team was as below
-
- Only two temperatures need to be adjusted for any target moisture keeping others constant. A table of values for these temperatures against every target moisture was given (Moisture value from 1.5% to 5.5%)
- Rate of change of variation for every 0.5 degrees change in any of these temperatures and corresponding impact on Moisture was given
BENEFITS:
Based on the recommendations, the critical control parameters are identified and for every moisture, setting recommended values are identified. This streamlines the process and reduces the variation in output moisture. So, the yield will be improved significantly.
This will give a benefit of up to USD 800,000 / annum / production line. This was extended to several lines in this factory as well as other factories.