Optimizing Financial Insights with Power BI Accounting Dashboards
Case Study
Optimizing Financial Insights with Power BI Accounting Dashboards
Creating a data-rich, efficient dashboard to gain insight into your business operations is like having a powerful flashlight in a dark room—it illuminates every corner, revealing what’s working and what needs improvement. From productivity to performance analysis, a clear dashboard provides an instant, empirical snapshot of your organization’s health, guiding you toward the right decisions.
At Codenatives, we’re committed to deploying the right expertise and adhering to industry best practice to craft dashboards that truly serve your business needs.
Are your reporting dashboards dim lights in the dark, or spotlights revealing every hidden detail?
Financial Analytics
With over 20 years of expertise in Data Analytics, Codenatives has helped financial and investment firms tackle complex data challenges. Using tools like Power BI, Qlik, and Tableau, we have delivered precise forecasting, improved reporting, and seamless integrations. Our experience in ETL, data modeling, and migrations has empowered clients to optimize operations and make smarter decisions.
We transform raw data into actionable insights, streamlining operations and boosting financial advisory capabilities. Our solutions ensure mobile access and provide expert support for seamless dashboard design and integration, driving your business growth.
Strategic Dashboard Development:
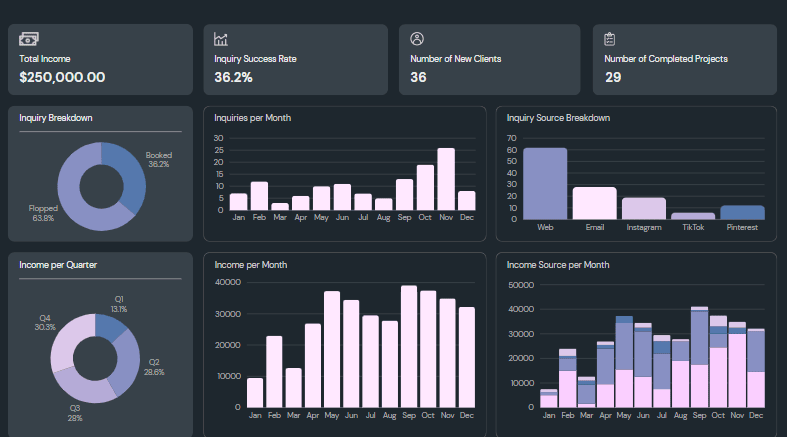
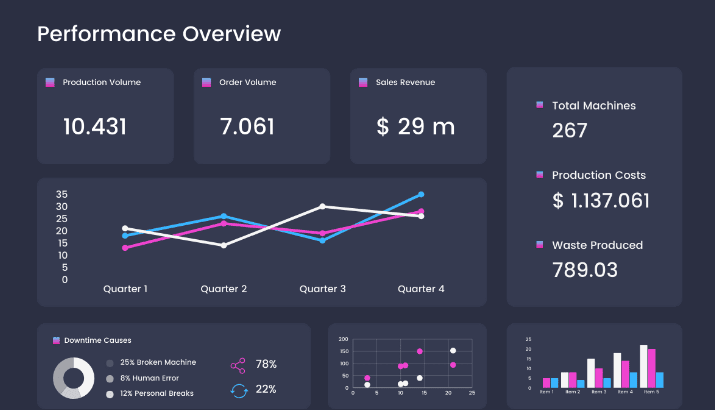
One of our clients entrusted us with developing a new Power BI dashboard, leveraging the five existing reports they provided. Our goal was to capture and visualize key metrics crucial to their business:
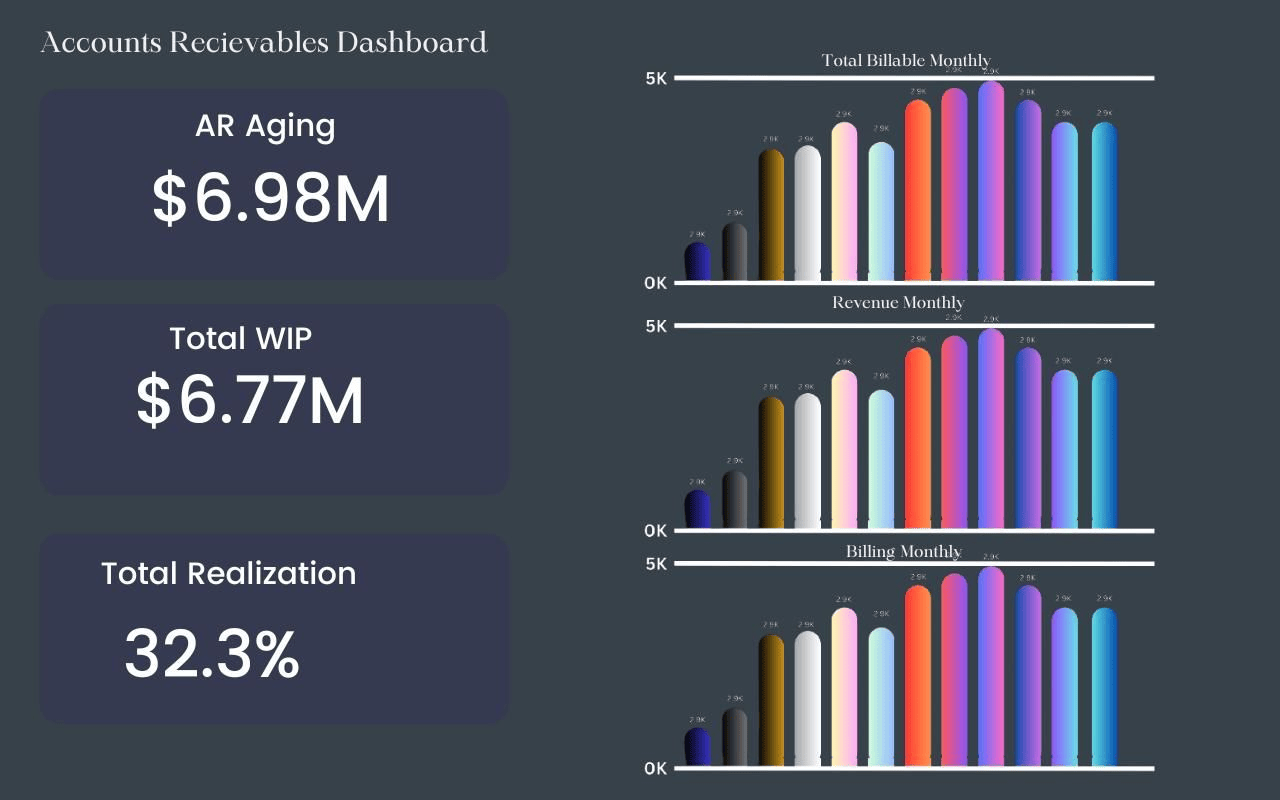
Tracked the age of work in progress to identify potential bottlenecks.
All technical components of the dashboard adhered to industry standards and best practices, ensuring reliability and scalability.
Leveraging SQL Server for Data Integrity:
We utilized SQL Server as the primary data source, developing ad-hoc queries for cross-verification and validation to maintain data integrity and support the creation of a trustworthy dashboard.
Tailored Manpower Deployment:
To ensure the highest quality outcome and timely execution of your project, we carefully selected manpower based on a skill matrix aligned with your project requirements. This strategic deployment was designed to deliver exceptional results while adhering to strict timelines.
Comprehensive Methodology:
Our methodology began with a thorough evaluation of your existing reports and dashboards, utilizing Power BI, SQL Server databases, and relevant data sources. This evaluation helped us identify areas for improvement and ensured that the new dashboard was built on a solid foundation.
Learning from the Past: Our Approach to Enhancing Dashboard Performance:
Defective Dashboard Review:
As part of our commitment to continuous improvement, we diligently review the existing defective Power BI accounting dashboard. By assessing its calculations and identifying areas for improvement, we apply valuable lessons learned to the new dashboard, ensuring it meets your expectations and performs optimally.
Developing a powerful Power BI Accounting dashboard requires a strategic approach, skilled manpower, and a deep understanding of your business needs. By following our methodology, we can create a dashboard that not only provides critical insights but also drives informed decision-making. With key metrics like Total AR, Billable Hours, Revenue, and WIP Aging, your organization will be equipped to navigate the challenges of today’s business environment with confidence.
Transform your data into actionable insights with our Power BI dashboard.
Contact us now to elevate your decision-making and stay ahead.